Video engagement measures how actively viewers interact with your content. Watch time, completion rates, clicks, comments, quiz responses: these signals reveal whether people absorb what you publish or abandon it after thirty seconds.
Most enterprises have no shortage of video. Town hall recordings, training libraries, product demos, and onboarding walkthroughs sit scattered across platforms. The real problem isn't creating more content. It's getting people to actually watch it, absorb it, and act on it.
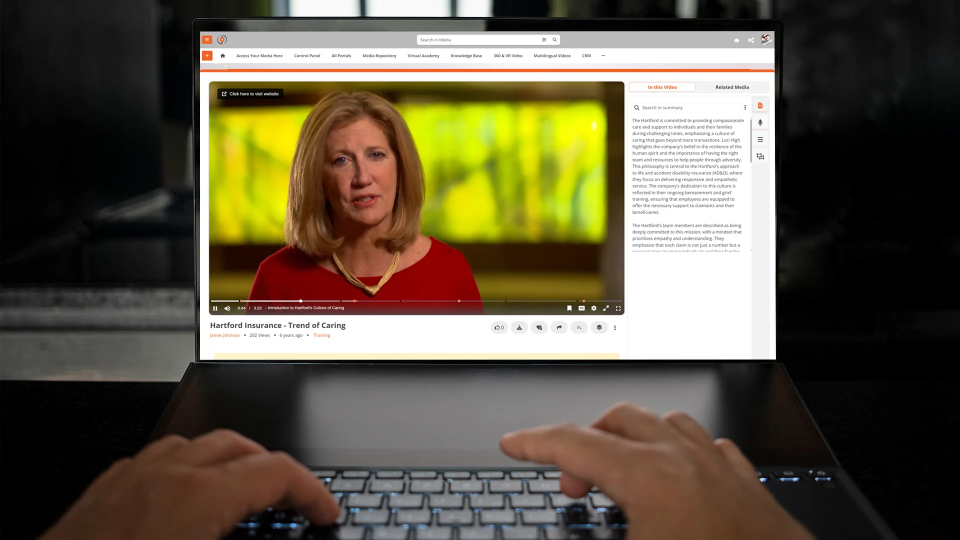
This guide covers what drives viewer participation in enterprise settings, which metrics actually matter, and how to turn passive viewing into measurable outcomes. VIDIZMO EnterpriseTube provides granular engagement analytics, including frame-level video heat maps and per-user activity tracking, so teams can pinpoint exactly where viewers pay attention and where they drop off.
What Does Video Engagement Really Measure?
The term gets used loosely, so let's be specific. Video engagement refers to any measurable interaction a viewer has with video content beyond pressing play. It spans passive signals like how long someone watches and active signals like answering a quiz, clicking a link, or sharing the video with a colleague.
Common engagement metrics fall into three tiers:
- Consumption metrics: Play rate, average watch time, completion rate, drop-off points
- Interaction metrics: Quiz responses, poll answers, comments, bookmarks, content downloads
- Outcome metrics: Certification completions, post-video assessment scores, click-throughs to related resources
Consumption metrics tell you whether people showed up. Interaction metrics tell you whether they paid attention. Outcome metrics tell you whether the content worked. Most organizations track only the first tier and wonder why their video programs feel stagnant.
Why Do Enterprise Video Programs Struggle with Low Engagement?
The reasons are predictable but often overlooked.
A Forrester study found that knowledge workers spend roughly 30% of their time searching for information across enterprise tools, one of several industry estimates that place this figure between 20% and 36% depending on methodology.
Videos are too long and unstructured. A 90-minute town hall recording with no chapters, no timestamps, and no summary forces viewers to scrub through the entire file looking for the five minutes that matter to them. They won't.
There's no feedback loop. When L&D teams publish training videos without tracking who watched, how far they got, or whether they understood the material, there's no mechanism for improvement. Content creators keep producing. Viewers keep ignoring.
Passive formats dominate. One-way video with no interactivity treats every viewer the same way. Adding quizzes, polls, or branching paths turns a monologue into a conversation.
Which Engagement Metrics Should You Track First?
Not all metrics carry equal weight. The right ones depend on your use case.
.jpg?width=800&height=268&name=image%20(12).jpg)
Video heat maps deserve special attention. They show frame-by-frame data on where viewers rewatch, skip, or abandon content. A spike in rewatches at the 4:30 mark of a training video means that section is either confusing or critically important. A steep drop-off at minute two means your intro is losing people. This level of detail turns guesswork into editorial decisions.
How AI-Powered Features Improve Viewer Participation
AI has changed what's possible with enterprise video, and the impact on engagement is direct.
Automatic transcription and captioning make every video searchable and accessible. Viewers can scan a transcript, jump to the exact moment they need, and move on. Per the W3C Web Content Accessibility Guidelines (WCAG), captions also support viewers with hearing disabilities, those in sound-sensitive environments, and non-native speakers.
AI-generated chapters and summaries break long recordings into navigable segments. Instead of watching an entire 60-minute webinar, a viewer can skip to "Q&A on pricing strategy" or "product roadmap update." This alone can lift average watch time because viewers engage with the parts that matter to them rather than abandoning the whole recording.
Semantic search lets employees find videos by concept, not just title. Searching for "how to submit an expense report" should surface the exact training video and timestamp, even if those words never appear in the video's title or description.
Organizations that implement AI-powered search and chaptering tend to see higher content reuse because employees can actually find and navigate to what they need.
Five Practical Strategies to Boost Engagement
- Keep training videos focused and well-edited rather than defaulting to a fixed length. TechSmith's viewer research found that length alone isn't what drives people to stop watching, boredom and low content quality are the top reasons viewers abandon a video, cited far more often than runtime. That said, shorter videos are easier to keep tight: break longer topics into a focused series rather than one long recording, and use chapters so viewers can skip to what's relevant to them.
- Add interactive elements. In-video quizzes, polls, and surveys transform passive watching into active learning. For compliance training, they also create auditable proof that employees engaged with the material, not just pressed play.
- Use playlists and learning paths. Curate content into structured sequences rather than dumping standalone videos into a library. Guide viewers through a logical progression.
- Personalize the experience. Segment audiences by role, department, or location and surface relevant content to each group. An engineer and a sales rep shouldn't see the same homepage when they log into the video portal.
- Close the feedback loop with analytics. Review engagement data monthly. Identify your lowest-performing content and either improve it or retire it. Double down on formats and topics that earn high completion rates.
How EnterpriseTube Drives Measurable Video Engagement
VIDIZMO EnterpriseTube is built around a simple principle: content only delivers value when people actually engage with it. The platform provides frame-level video heat maps showing exactly where viewers rewatch, skip, or drop off. Per-user activity tracking lets L&D teams see who completed training and who stalled at module three.
Interactive features include in-video quizzes, surveys, and handouts that can be embedded at any timestamp. For organizations using learning management systems, SCORM 1.2/2004 and LTI 1.3 integration (available on the Premium tier) means engagement data flows directly into existing LMS reporting. AI-powered transcription supports 82 languages, making content accessible and searchable for global teams.
The analytics dashboard surfaces geographic heat maps, quality-of-experience metrics (player load time, buffering rates, cache hit ratios), and exportable reports that connect video performance to business outcomes.
Contact us today or Learn how VIDIZMO helps enterprises drive video engagement.

Turning Views into Value
Publishing video content is the easy part. Getting employees, customers, or stakeholders to engage with it requires intentional design: shorter formats, interactive elements, AI-powered search, and analytics that tell you what's working.
Organizations that treat video engagement as a measurable business metric, not a vanity number, are the ones seeing real returns on their video investments. Start by auditing your current completion rates and heat map data. The gaps will tell you exactly where to focus.
FAQ
Frequently Asked Questions
What is video engagement in an enterprise context?
Video engagement refers to measurable viewer interactions with video content, including watch time, completion rates, quiz responses, comments, and click-throughs. In enterprise settings, engagement data helps L&D, HR, and communications teams prove that content reaches its intended audience and drives the desired outcomes.
How do you measure video engagement effectively?
Track metrics across three tiers: consumption (play rate, completion rate, drop-off points), interaction (quiz scores, poll responses, comments), and outcomes (certification completions, assessment pass rates). Video heat maps provide the most actionable data by showing frame-level rewatch and skip patterns.
How does VIDIZMO EnterpriseTube track video engagement?
EnterpriseTube provides granular analytics including per-user activity tracking, video heat maps with frame-level rewatch and drop-off data, geographic viewer maps, and quality-of-experience metrics. Reports are exportable and integrate with SCORM-compatible learning management systems (on the Premium tier) for unified training analytics.
What is a good video completion rate for training content?
Completion rates above 70% are generally considered strong for enterprise training videos, though benchmarks vary by industry and content type. Videos under 10 minutes tend to achieve higher completion rates than longer recordings. Adding interactive elements like quizzes can increase completion by encouraging active participation rather than passive viewing.
How does video engagement compare between live and on-demand content?
Live events typically generate higher peak engagement because of real-time interaction through chat, polls, and Q&A. On-demand content offers sustained engagement over time and lets viewers rewatch difficult sections. The most effective enterprise video strategies combine both formats: live events for announcements and on-demand libraries for training and reference material.
Can AI improve video engagement rates?
Yes. AI-powered features like automatic transcription, chapter generation, and semantic search make videos more discoverable and navigable. When viewers can search by concept, jump to relevant chapters, and read along with captions, they're more likely to find value in the content and watch longer. VIDIZMO supports AI transcription in 82 languages, extending these benefits to global organizations.
TopicsVideo Content ManagementEnterpriseTubeEnterprise Video Platform

About the author
Ali Rind is a Product Marketing Executive at VIDIZMO, where he focuses on digital evidence management, AI redaction, and enterprise video technology. He closely follows how law enforcement agencies, public safety organizations, and government bodies manage and act on video evidence, translating those insights into clear, practical content. Ali writes across Digital Evidence Management System, Redactor, and Intelligence Hub products, covering everything from compliance challenges to real-world deployment across federal, state, and commercial markets.
You may also like

Deploying a Low-Latency Surveillance Pipeline: An Architecture Guide
"Real-time" is one of those phrases that gets used loosely, and in a video analytics pipeline it hides a lot of ...
Choosing a GPU for Real-Time Video Analytics
Capacity planning tells you how many GPUs a deployment needs. This is the other half of the question: which GPU to ...
GPU Capacity Planning for Real-Time AI Video Analytics
Ask a vendor how many cameras their AI runs on one GPU and you will usually get a single confident number with no ...