Twice a day, every school in the country runs a mass movement operation that would make a stadium operations manager sweat: the entire population of the building, plus a fleet of buses, plus a line of parent vehicles, all converging on the same doors and driveways inside the same twenty minutes. In between, the building runs a dozen smaller versions, the passing-period crush at the stairwell everyone uses, the cafeteria line that backs into the corridor, the assembly letting out, the Friday game emptying the bleachers through two gates. Schools manage all of it with experience and positioning, the administrator at the door, the aide at the stairs, and experience works until the day something changes, a construction closure, a fire alarm during lunch, a crowd surge at an event, and the day it changes is the day nobody has data about how the building actually flows. This article is about measuring and alerting on crowd conditions with the cameras already watching them, and it belongs to our full guide on AI video analytics for school and campus safety.
Density, flow, and thresholds
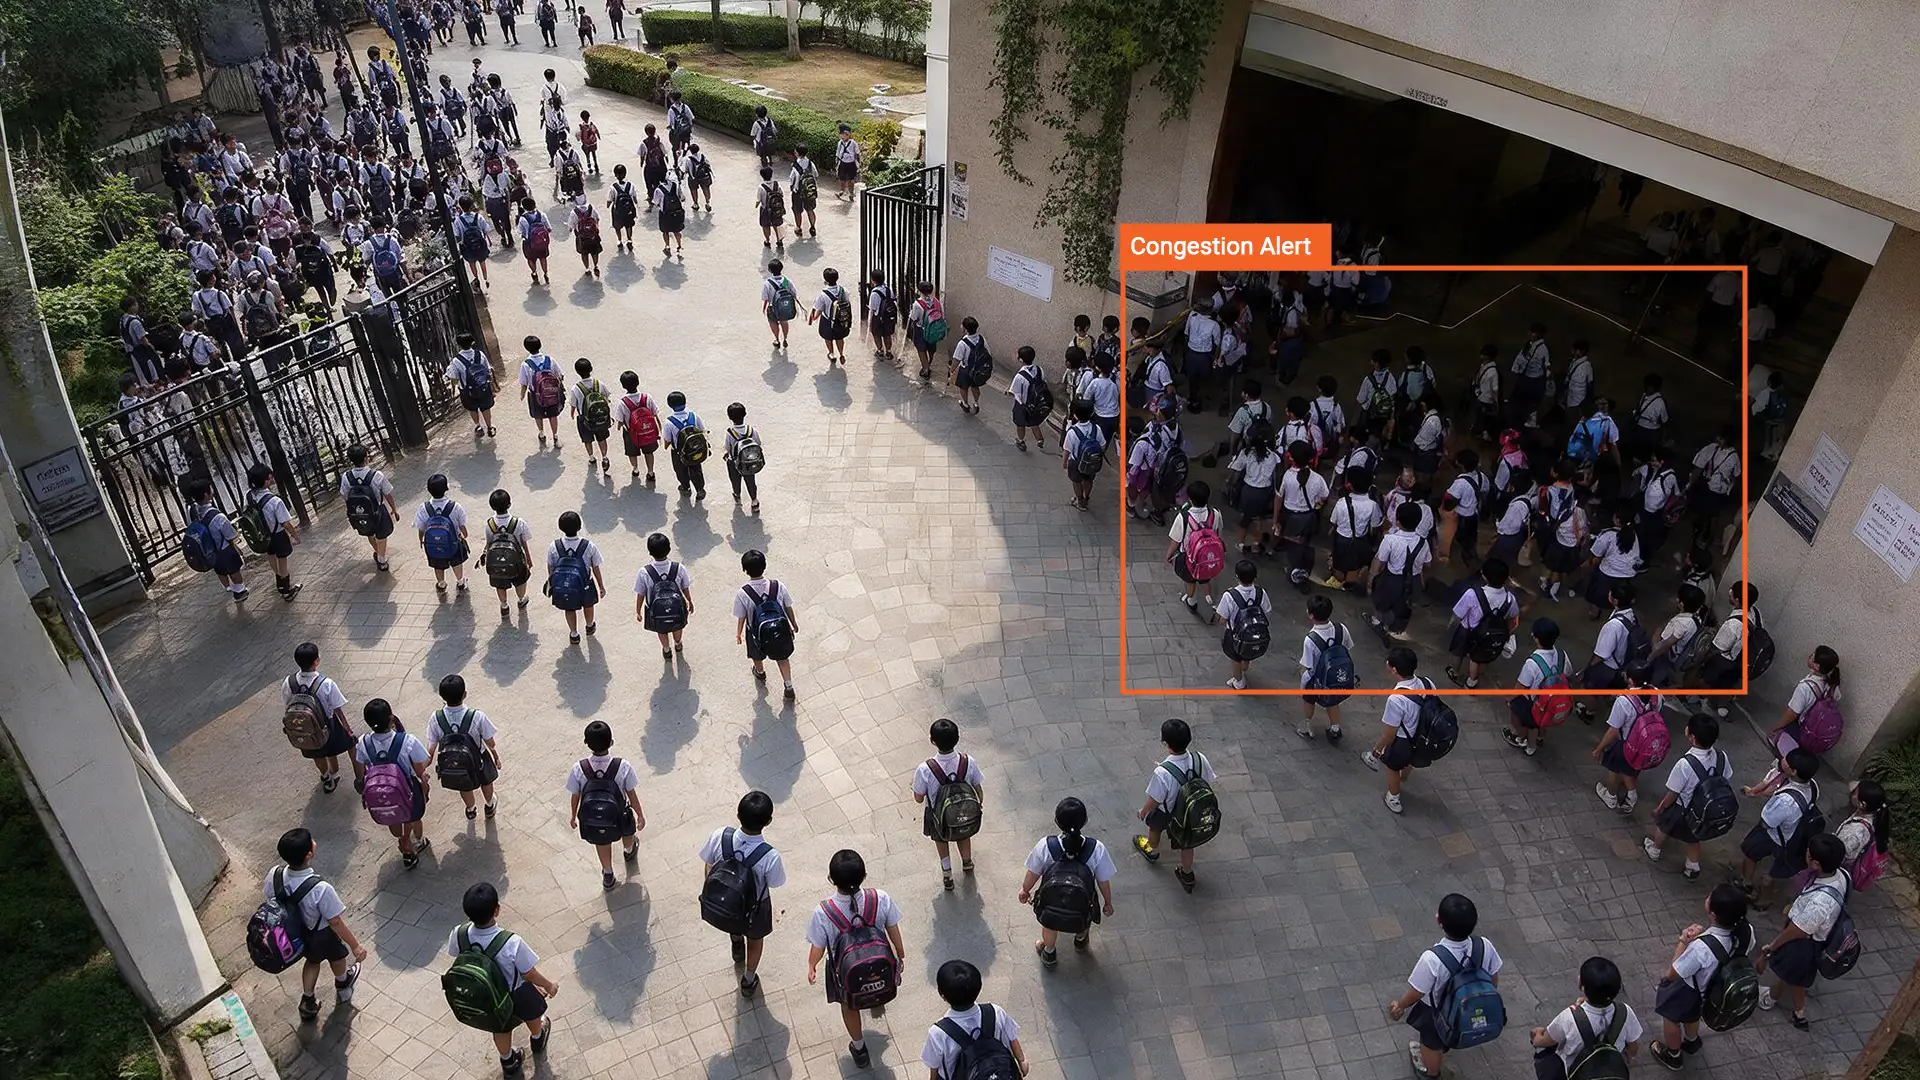
The detection kit for crowds is the plainest in this series, which is part of its charm: it counts. Crowd rules fire when the number of people inside a drawn zone exceeds a capacity the school sets, direction rules catch flow running against the expected pattern, dwell rules catch the queue that has stopped being a queue and become a blockage, and tracking underneath keeps the counts honest as people move between zones. Everything else is knowing where to draw the zones and what numbers to write, and a school is unusually well equipped for both, because its choke points are known by name and its schedule makes normal legible: the same corridor, at the same minute of the same period, is comparable day after day in a way no mall or terminal ever is.
The zones that earn their monitoring at nearly every campus make a short list. The stairwells and corridor junctions that carry disproportionate passing-period load, where the crowd threshold is a safety line, not a comfort preference. The cafeteria service line and its spillover corridor. The gym and auditorium exits during events, where egress rates decide how fast a building can empty and where a threshold crossed during an evacuation is a life-safety fact. The dismissal edges, covered in their own section below. And the assembly points named in the emergency plan, whose real capacity and fill rate almost no school has ever measured until the cameras start counting.
Two properties keep this layer school-appropriate by construction. Counting is anonymous, density and flow are properties of the crowd rather than of any student, so the no-identification default this series maintains costs nothing here and should be stated to the community anyway. And the alerts are operational by default, routed to the adults who manage the space rather than to a security queue, because most crowd events are management problems, the second lunch line opening late, not security problems, and the framing keeps the program in the right part of the school's mind.
Measuring the dismissal window
Dismissal deserves its own treatment because it is the riskiest routine thing most schools do. The entire student body crosses the same edges of campus where buses maneuver and parent vehicles queue, the youngest students in exactly the mix of pedestrians and vehicles that the industrial half of this platform family treats as its highest-severity scenario, and the whole operation runs on bell timing and adult positioning that was designed once and adjusted by anecdote since.
Instrumented with counts and rules, the window becomes legible for the first time. Zone counts on the bus loop, the parent-pickup lane, and the walker routes show the actual overlap of pedestrian and vehicle peaks, minute by minute, day after day. Vehicle-and-pedestrian rules at the crossings fire on the near-miss pattern, the car moving while the crosswalk zone is occupied, and ninety days of those events is a map of exactly where the eventual serious incident is being rehearsed, the same near-miss logic the safety literature runs on everywhere. Dwell rules on the loop catch the bus that has not moved and the lane that has stopped draining, which is operations gold on the day the line backs onto the arterial and the city calls the district office.
What districts do with the data follows the hierarchy this series always recommends: the physical fixes first, the crossing relocated, the barrier placed, the loop re-striped, argued from counts rather than complaints; the schedule fixes second, staggered release validated by the flow data instead of by feel; the positioning fixes third, adults moved to where the events actually cluster. And the before-and-after measurement is automatic, because the zones keep counting after the change, which turns dismissal redesign from a debate into an experiment.
Game nights, drills, and evacuations
The school calendar is punctuated by days when normal thresholds are wrong on purpose, the game, the concert, the graduation, and the crowd layer handles them the way the schedule handles everything in a school deployment: event profiles, with their own zone capacities and their own alert routing, activated for the evening and expired by morning. During events, the value concentrates at the exits and the choke points, where a threshold crossed while everyone is leaving is precisely the moment operations staff need eyes, and the convergence signature this series describes in the fight-detection article stays armed, because event crowds are where altercations find their audience.
Evacuations and drills are the sharpest case the crowd layer serves. When the building empties, the questions that matter are empirical: how long did each wing take, which exits carried the load, did the assembly areas fill as planned, was anyone moving against flow. The zone record answers all of them per drill, which converts the fire-drill debrief from impressions into timings, and in a real event the same live counts tell the incident commander which routes are flowing and which have jammed, while the person-down logic from our medical emergencies article stays armed along the routes, watching for exactly what evacuation crowds occasionally produce.
Using the data to fix the building
A term of crowd data changes how a building understands itself, and the district that reads it gets improvements no consultant walk-through produces. The passing-period heat map, which corridors run at what density each period, feeds the next bell-schedule review with evidence, and the worst crush in the building is usually relievable by minutes of stagger once someone can see it. The cafeteria's queue profile answers the staffing question, when the second line actually needs to open, with a number. The event-night egress data becomes the fire marshal conversation a facilities director wants to have, capacity assumptions checked against measured rates. And the year-over-year record, thresholds crossed, events per zone, response times, is the safety committee's evidence that the crowd program is a managed system rather than a set of cameras, which is the posture everything in this series builds toward.
The same approach at university scale
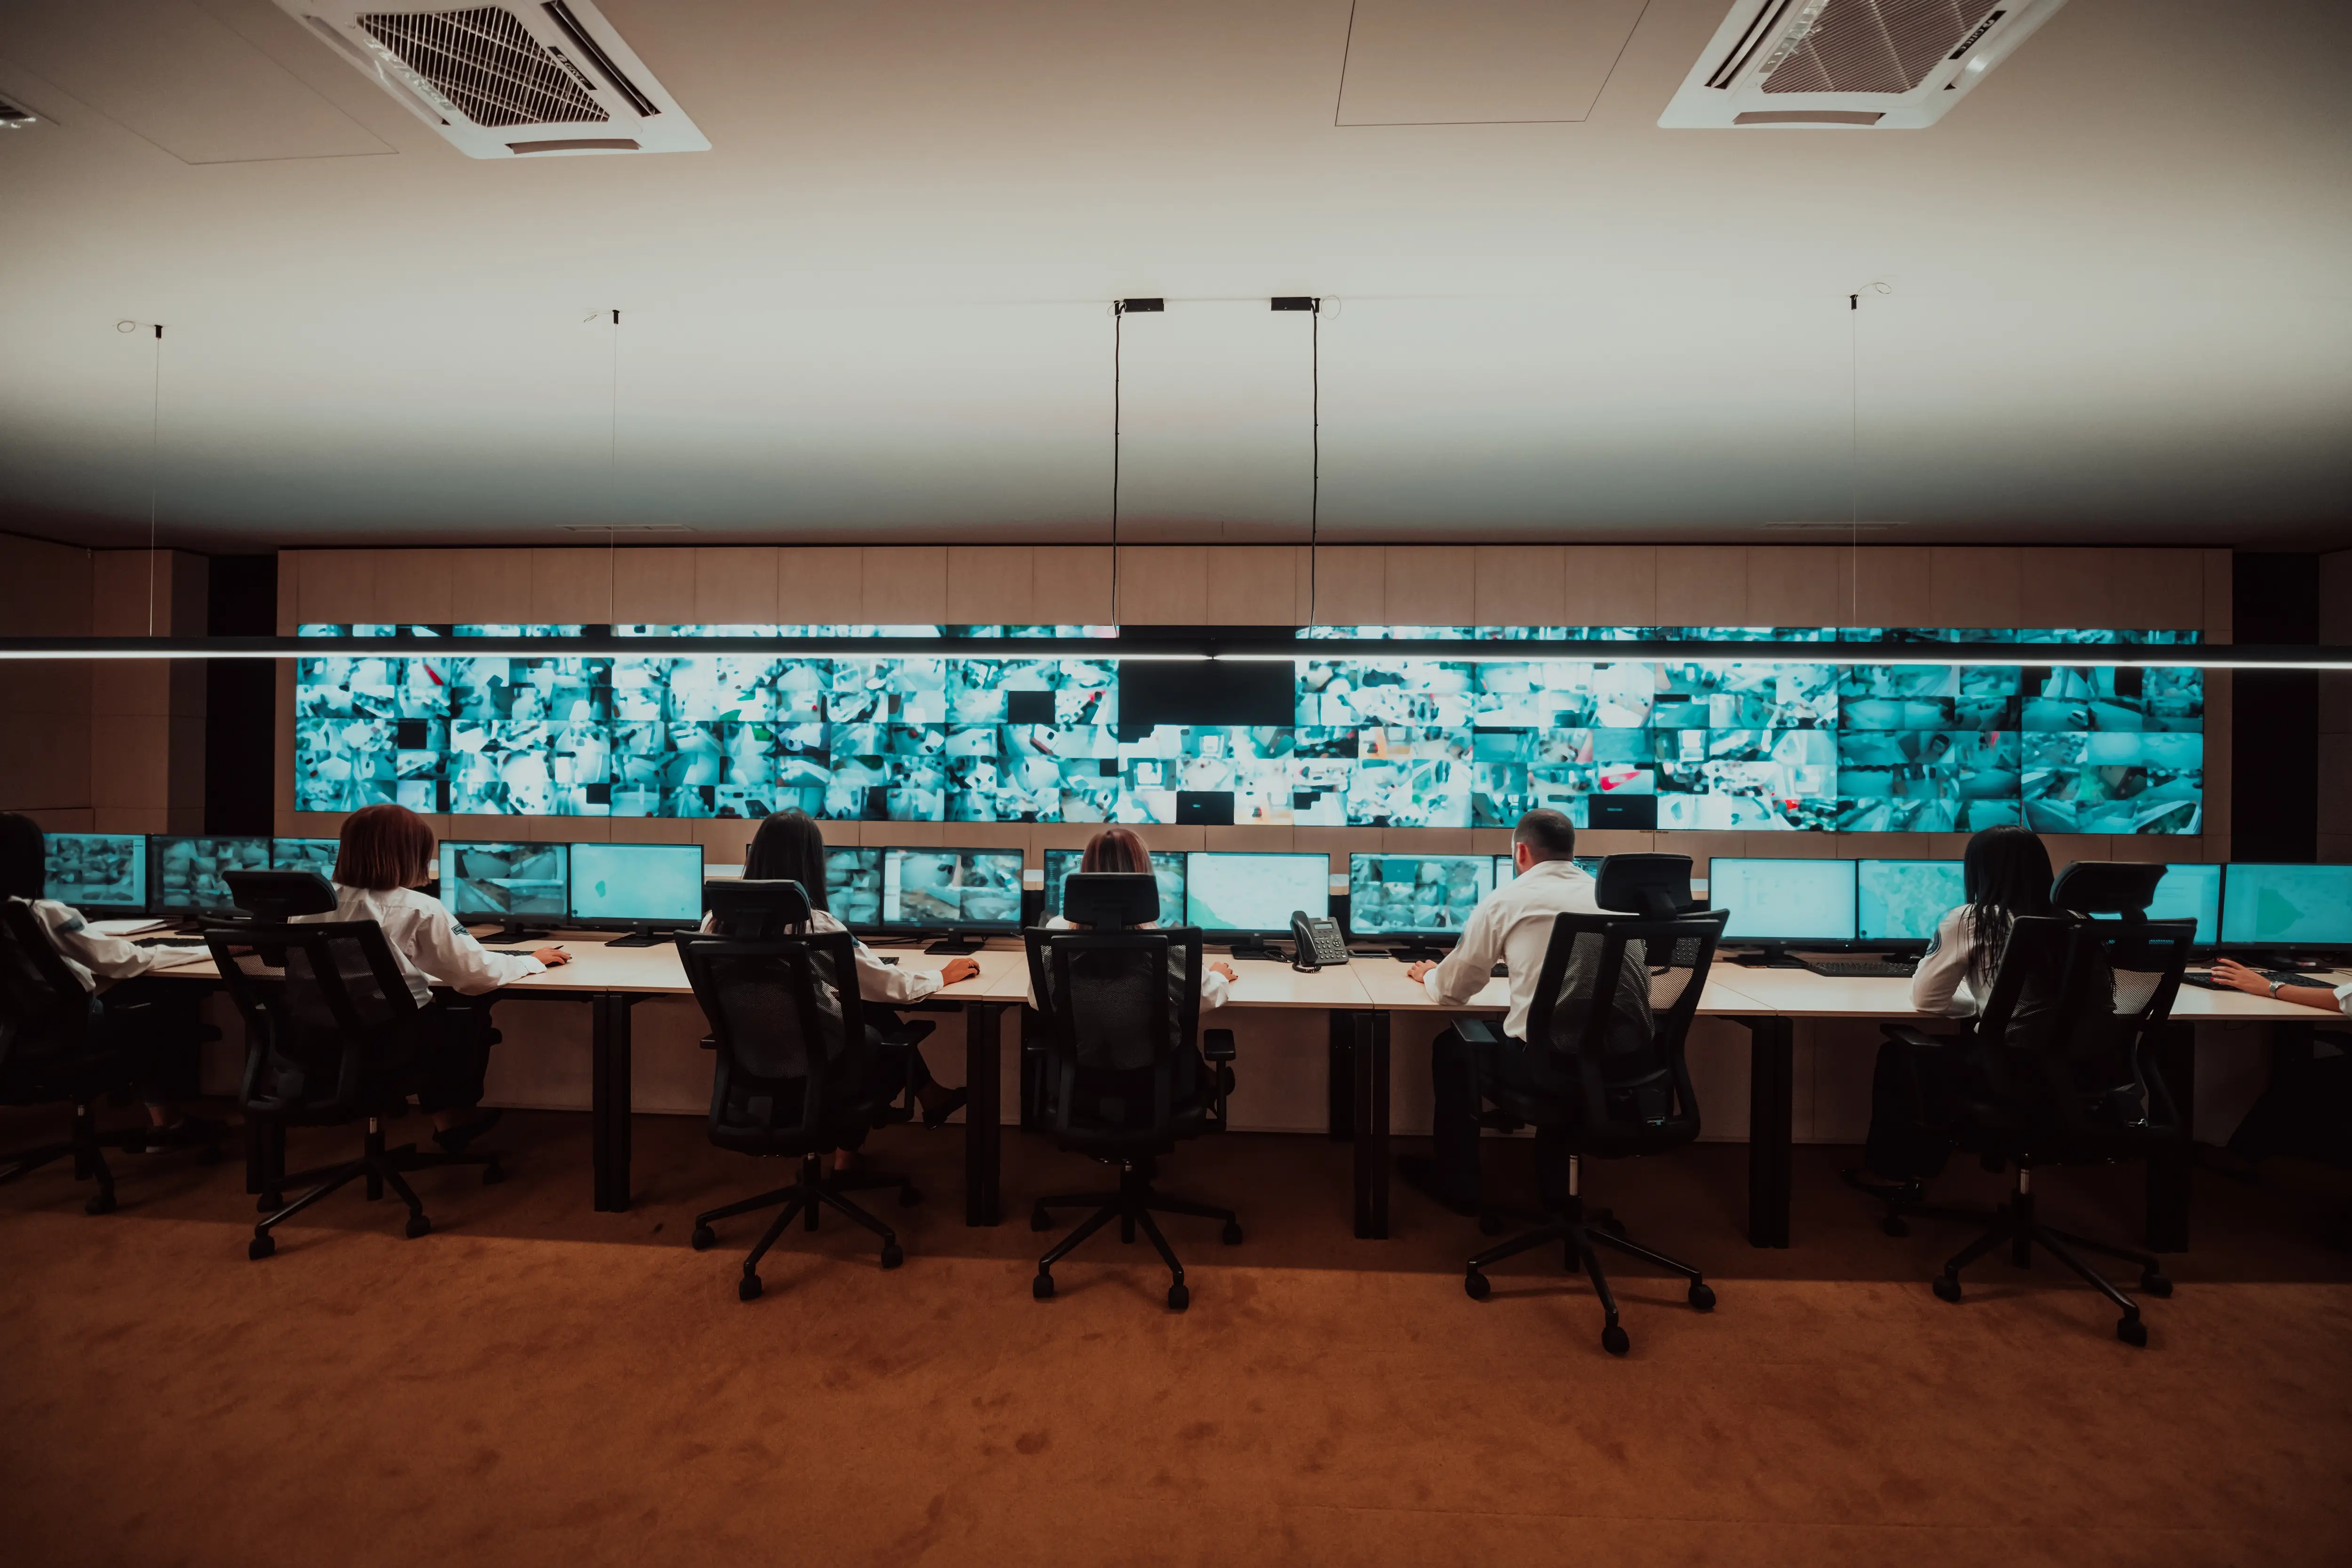
Universities run the same physics at different magnitudes, and the crowd layer stretches to meet them. The passing crush becomes the ten-minute migration between lecture blocks, measurable across quads and crossings rather than corridors; the cafeteria line becomes the dining hall and the student center at noon; the event becomes a stadium's worth of egress through campus streets; and move-in weekend is a dismissal window that lasts three days. The additional capability campus scale earns is the operations-center view, live density across the campus feeding a real security operations desk, and the additional stakeholder is the events office, which discovers that egress timing data turns venue scheduling and staffing from folklore into planning. The governance posture is unchanged, anonymous counts, stated scope, no individual tracking, and it is worth restating at the campus town hall anyway, because a university community asks the surveillance question faster than any school board.
Weather, closures, and the abnormal days
The crowd layer also carries the days nobody schedules. A weather dismissal compresses the normal window into chaos on wet pavement; a lockdown drill inverts every flow in the building; a transit failure at a university strands a building's worth of people at the wrong edge of campus. On those days the live counts are the operations picture, which routes are moving, where the backlog is forming, whether the alternate exit is actually being used, and the district that has normal-day baselines reads the abnormal day at a glance, because abnormal is visible only against measured normal. It is the same lesson the industrial half of this platform family teaches about anomaly detection generally: the value of knowing your normal is that departures announce themselves.
How VIDIZMO fits
VIDIZMO AI Live Insight runs the crowd, direction, and dwell rules on the cameras a school already owns, on the district's own hardware, with zones drawn per camera, capacities and schedules per zone, and event profiles for the nights the building is not itself. Counts and threshold events land on the timeline with clips preserved in the Nexus portal, alerts route to the adults who own each space with snapshots attached, and the aggregate flow data exports to whatever the district plans with, while the written scope register and the anonymous-counting design keep the program exactly what this article describes: measurement of spaces, never surveillance of students. Transit-dependent campuses add one more edge worth drawing: the public bus stop or rail entrance just off school property, where the afternoon surge is predictable and the district's authority is not. The workable pattern watches the school side of the line, coordinates with the transit agency on the rest, and uses the flow data as the shared evidence both parties plan against, which is often the first time either side has seen the surge measured rather than described.
Athletics deserves the final word, because game nights are where school crowd management meets its stadium-scale cousin. Rivalry games, playoff crowds, and the postgame mix of departing spectators and team buses concentrate a semester of crowd risk into three hours, and the event profile for those nights, tighter exit thresholds, armed convergence rules, staff routed by live counts, is the difference between working the game and watching it happen.
And the same counting layer doubles as the utilization evidence the operations side of the institution keeps asking for: which spaces actually fill, when the library peaks, whether the new commons pulls the traffic the architects promised. That thread belongs to the campus-operations conversation rather than the safety one, and the governance answer is the register: the safety program's scope document states which zones count for safety and which report to facilities, so one instrument serves both masters without the purposes blurring.
One tuning note keeps the layer honest across the year: school populations breathe, enrollment shifts, schedules change each semester, and a capacity threshold set in September describes a different building by February. The quarterly retune this platform family prescribes everywhere applies here as a calendar item, thresholds reviewed against the current term's baselines, and it is fifteen minutes that keeps the alert channel meaning what it meant.
The data also serves the quietest customer in the building: the emergency plan. Assembly-area capacities, egress rates, and route usage from real drills replace the estimates the plan was written on, and the annual plan review becomes an update against measurements, which is exactly what a fire marshal hopes to see and rarely does.
A configuration note for the youngest campuses: elementary dismissal is its own special case, because the walkers are small, the parent-vehicle line is long, and the difference between orderly and dangerous is one distracted minute. Zones there run tighter, thresholds run lower, and the crossing rules deserve the highest severity on the campus, which is also the honest answer to where a one-school pilot should start when the district serves all grade levels.
The natural pilot is the dismissal window at one school for one month, silent, and the first heat map of the pedestrian-vehicle overlap tends to fund the rest of the program by itself.