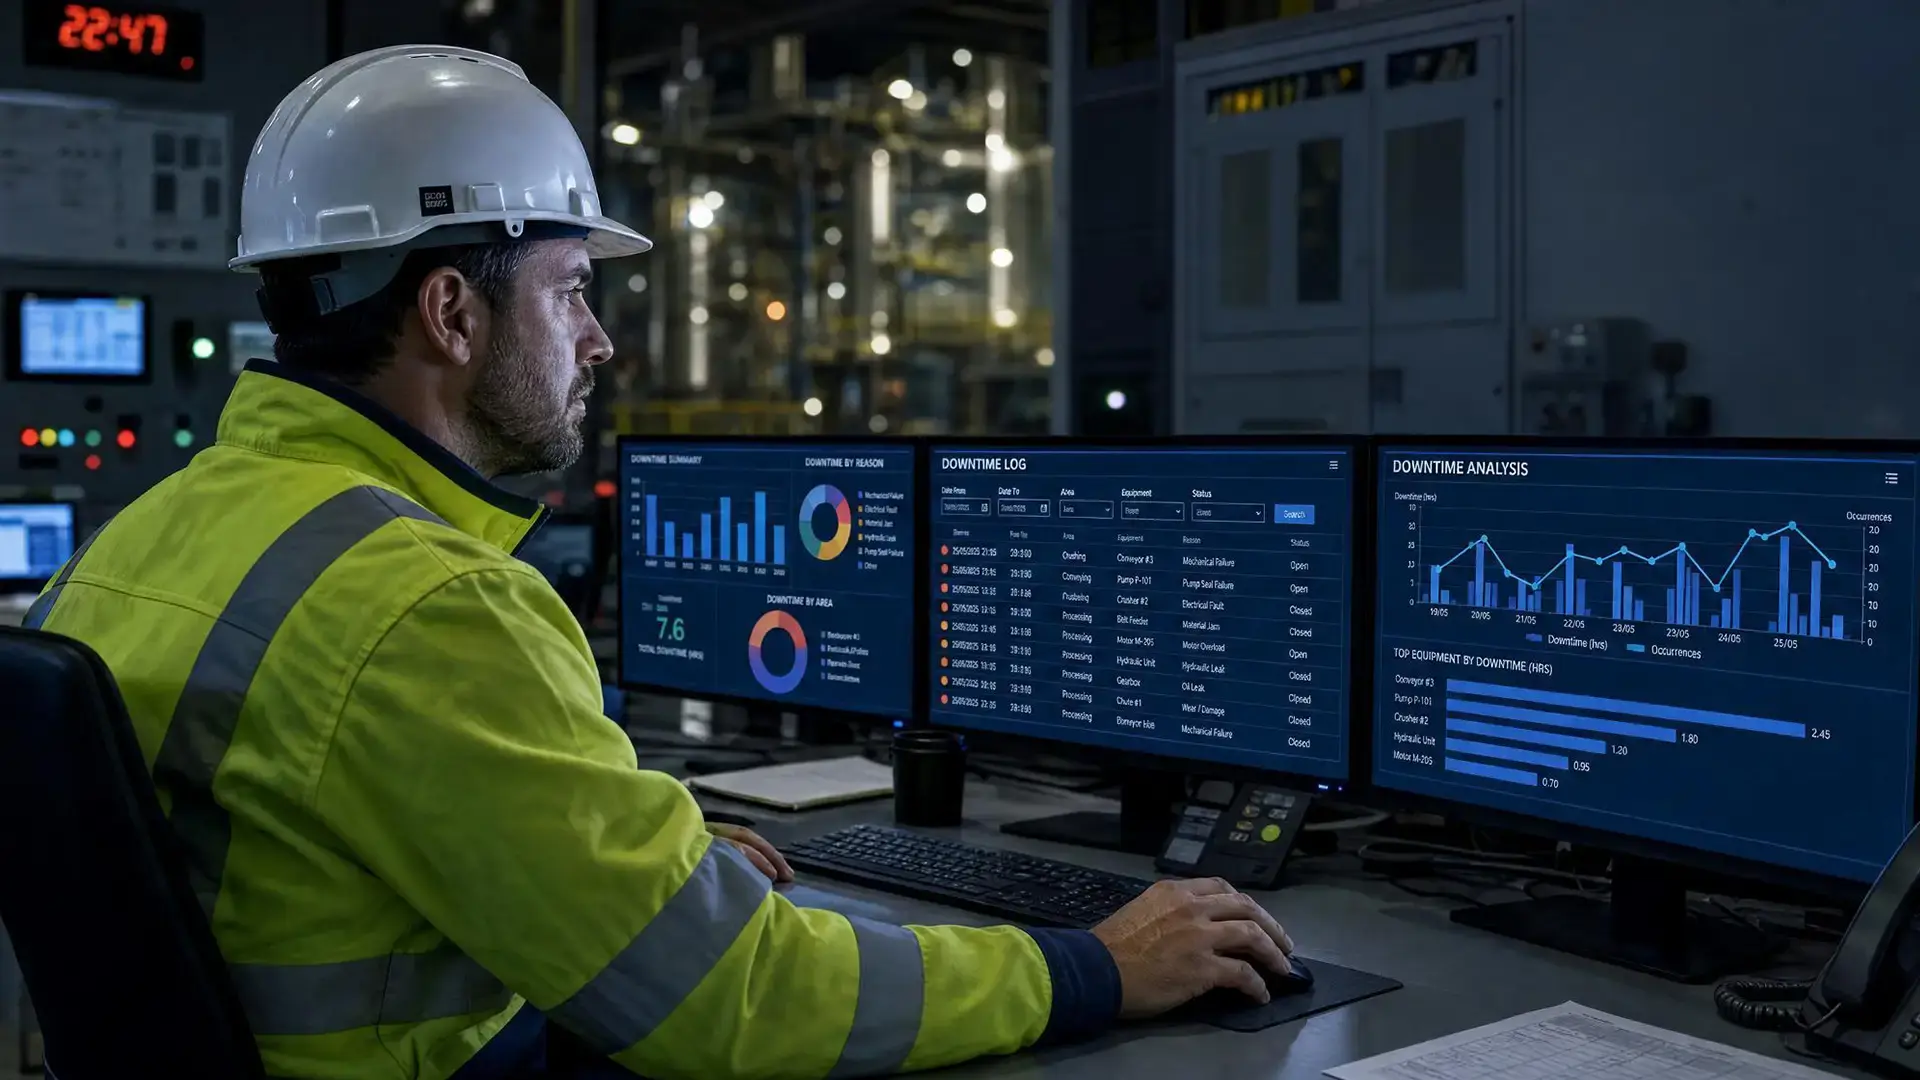
Every plant has a downtime log, and every honest operations director will admit what lives in its cause column: categories chosen from a dropdown, minutes after the fact, by whoever restarted the line, under pressure to get running rather than to diagnose. "Mechanical." "Material." "Other," the perennial champion. The log then feeds the Pareto chart, the Pareto feeds the improvement plan, and the improvement plan inherits every guess the dropdown absorbed. Meanwhile the cost of what is being guessed about keeps climbing: Siemens' True Cost of Downtime research, as reported by the Institute for Supply Management, put unscheduled downtime at 11 percent of annual revenues across the world's 500 largest companies, around $1.4 trillion, up sharply from the roughly $864 billion measured five years earlier, with automotive plants losing in the neighborhood of $2.3 million per hour. Numbers that size buy a great deal of diagnostic capability, and this article is about the diagnostic layer most plants are missing: the visual record of what actually happened around the stop. It extends our pillar guide to AI-powered video analytics for manufacturing.
Detecting the stop
Knowing the line stopped is rarely the problem; knowing promptly, precisely, and everywhere is. The Programmable Logic Controller (PLC) layer reports the states it was built to report, and a surprising amount of downtime happens in the seams: the manual cell with no instrumentation, the conveyor that runs while product does not, the station that is technically available and practically abandoned because its operator is off chasing material. Visual detection covers the seams with the same building blocks this series has developed elsewhere, motion and flow detection types that see stopped product on a running line, dwell rules that catch material sitting where it should move, and machine-state detection types trained to read what a camera can see of a machine, indicator stacks, gate positions, the visible signatures of running versus stopped versus jammed.
The value in the detection half is timestamp integrity. A stop that enters the record when it happens, rather than when someone reaches the terminal, produces duration data that can be trusted, and duration is the half of the downtime equation the dropdown at least tried to capture. But the transformative half is the other one.
Getting real causes instead of dropdown codes
The reason downtime causes are guessed is not laziness. It is that by the time anyone investigates, the evidence is gone: the line has been cleared, the jam pulled apart, the material moved, and the only witnesses are the people who were busy fixing it. Reconstruction from that position is exactly the situation accident investigators face, and the remedy is the same one our article on investigating workplace accidents from footage develops: preserved video around the event, reaching back before it began.
Event-driven recording does this mechanically, with nobody deciding in the moment what deserves preserving. A stop detection triggers a clip that includes configurable pre-event footage, which means the record contains the minutes before the stop, and the minutes before are where causes live. The jam's actual origin, two stations upstream, forty seconds earlier, when a deformed carton left the erector. The material change that preceded the wrapper fault. The operator intervention that held the problem off twice before it won. The reviewer sees the stop the way nobody standing at the restarted line ever can, as the end of a sequence rather than an isolated fact, and the cause column entry becomes a description of what the footage shows rather than a category chosen under time pressure.
For the stops that resist even visual diagnosis, the escalation layer this series keeps returning to earns its place: a preserved clip put to a multimodal model with a written question, describe what happens at the labeler in the ninety seconds before the stop, returns a second reading with no stake in any department's version. The cautions travel with it as always, the prompt goes in the record, and no accuracy figure exists for open-ended readings, so they inform the reviewer rather than replace one.
Measuring micro-stops
Every downtime conversation eventually reaches the losses below the logging threshold, and most stall there, because sub-minute stops are individually trivial, collectively enormous, and administratively invisible: no operator logs a forty-second clearance, no system built on operator logging ever will, and the PLC sees nothing when the line technically runs while a human wrestles it. The visual record is the first instrument that counts this layer at its true size. Dwell and flow detections capture each pause with duration and location, hand interventions appear as recurring events at the stations that demand them, and the weekly sum, presented beside the official log, is reliably the most uncomfortable number in the room. Sites should prepare for the political effect: a micro-stop total that dwarfs the logged downtime does not mean the log was dishonest, it means the log measured what it could see, and the correct response is to point the improvement effort at the newly visible layer rather than to relitigate the old numbers. The stations that tax every shift forty seconds at a time are, hour for hour, often cheaper capacity to recover than the dramatic failures the Pareto used to lead with.
Running the downtime review on evidence
The weekly downtime meeting inherits its shape from the data it consumes, and evidence changes the shape. The working format that emerges at sites running this stack: the reliability lead brings the week's stops ranked by evidenced cause rather than dropdown category, each major entry carrying its clip and, where the correlation layer found one, its machine-event context; the review watches the top items rather than debating them; and each accepted cause leaves the room with an owner, an action, and its verification metric, the before-and-after stop rate the zones will report automatically. Two roles change most. The line supervisor stops being the defendant explaining the minutes and becomes the narrator of what the footage shows, a shift in posture that improves both the meeting and the log, since causes no longer arrive pre-shaped by self-defense. And the maintenance planner gains a request queue with evidence attached, which shortens the argument phase of every work order and, over months, rebuilds the credibility of the downtime program itself: when the numbers are watchable, the numbers get believed, and believed numbers move budgets.
Joining the video to the machine record
The full picture of a stop has two halves that have historically lived apart: what the machines logged and what physically happened. The control system knows the fault code, the speed profile, the interlock that opened; the cameras know the carton, the intervention, the human context. Every serious downtime investigation wants both on one timeline, and the integration surface makes that practical: detection events flow out through the REST API and webhooks into the plant's historian, Manufacturing Execution System (MES), or maintenance system, carrying timestamps that let visual events sit beside machine events in whatever tool the reliability team already uses. Correlation rules evaluated over the recorded event stream can express the compound conditions that single detections cannot, the patterns spanning cameras and minutes, and the details of both directions, events out and conditions across sources, are covered in this series by connecting video AI to MES and Supervisory Control and Data Acquisition (SCADA) and correlating a line stop with what the cameras saw.
What emerges from the joined record is the class of finding that neither half could produce alone. The fault code that always follows the same visual precursor. The "random" stops that cluster after a particular material lot arrives. The micro-stops the PLC never sees because the line technically keeps running while an operator wrestles it, which accumulate into hours that appear in no log and, per the Siemens-reported figures above, into money that appears in every P&L. Plants that assemble this picture consistently find their true Pareto differs from their dropdown Pareto, and the difference is where the improvement budget had been quietly missing.
From evidence to fewer stops
The point of better cause data is fewer causes, and the loop closes the same way it closes throughout this series. Each significant stop gets its evidence-based cause; causes aggregate into a Pareto that reflects footage rather than folklore; the top of the Pareto gets an engineering response; and the zones that never stopped watching verify whether the response worked, before-and-after stop rates for that station in a two-line chart. The verification step deserves emphasis because downtime countermeasures are notorious for addressing the reported cause rather than the real one, and a fix that does not move the measured rate has just been caught doing exactly that, cheaply, months before the annual numbers would have said so.
There is an organizational corollary worth stating alongside the technical one. When the cause record is evidence, the weekly downtime review changes character, from a negotiation between departments about whose category the minutes land in, to a review of clips and timelines where the question is what to fix. Sites report the same cultural shift the safety and near-miss articles describe: arguments about what happened evaporate when what happened is watchable, and the remaining argument, why it happened and what to do, is the one worth having.
There is also a scheduling dividend hiding in the evidence layer that deserves its own sentence. Planned downtime, the changeovers, cleanings, and PMs that the schedule budgets, runs against the same cameras, and the gap between planned duration and evidenced duration is recoverable capacity of the least controversial kind: no fault, no blame, just a plan that can now be built on measured intervals instead of inherited estimates. Sites that extend the downtime lens to the planned category routinely find it pays back faster than the unplanned side, because the fixes are procedural rather than mechanical and ship without a capital request.
Limitations
Camera-based downtime analysis observes what lenses can see, so enclosed processes and purely internal machine faults remain the historian's territory, and the aim is the joined record rather than a rivalry between data sources. State and product detection types for a specific plant are trained on its footage per engagement, the same scoping honesty that runs through this series. And the analysis layer that reads clips against written questions runs on cached frames downstream of the live pipeline, seconds behind reality, which is immaterial for diagnosis and stated here anyway, because this series does not sell cadence as instantaneous anywhere.
How VIDIZMO fits
VIDIZMO AI Live Insight puts the detection and recording layer on the cameras the plant already owns, processed on the customer's own hardware on site, with stop-relevant detection types trained on the plant's footage and zone rules drawn per camera. Every stop event lands timestamped with its pre-event clip preserved in the Nexus portal the deployment works alongside, under access control and retention, reviewable as a synchronized multi-camera timeline when the stop spans views. Events flow onward through the REST API and webhooks into the maintenance and MES systems that own the machine half of the record, and where the site licenses AI Intelligence Hub, clips can be put to written questions and event-driven workflows can assemble the first-pass investigation automatically, the pattern our article on agentic investigations develops in full.
One implementation note keeps the program honest with its own workforce: downtime evidence is about machines, materials, and flow, and the same footage inevitably contains people doing their jobs under pressure. The no-discipline architecture the safety side of this series establishes is not optional here, because a downtime program that becomes a tool for timing operators will lose both its data quality and its floor cooperation in a quarter. The clips explain stops; they do not audition workers, and the plants that write that down get to keep both the evidence and the trust.
The starting point is the line whose downtime log everyone distrusts most. Two weeks of detection with pre-event recording, reviewed beside the existing log, answers the only question that matters at pilot stage: how different is the truth from the dropdown. The gap is the business case, and it has yet to come back small.