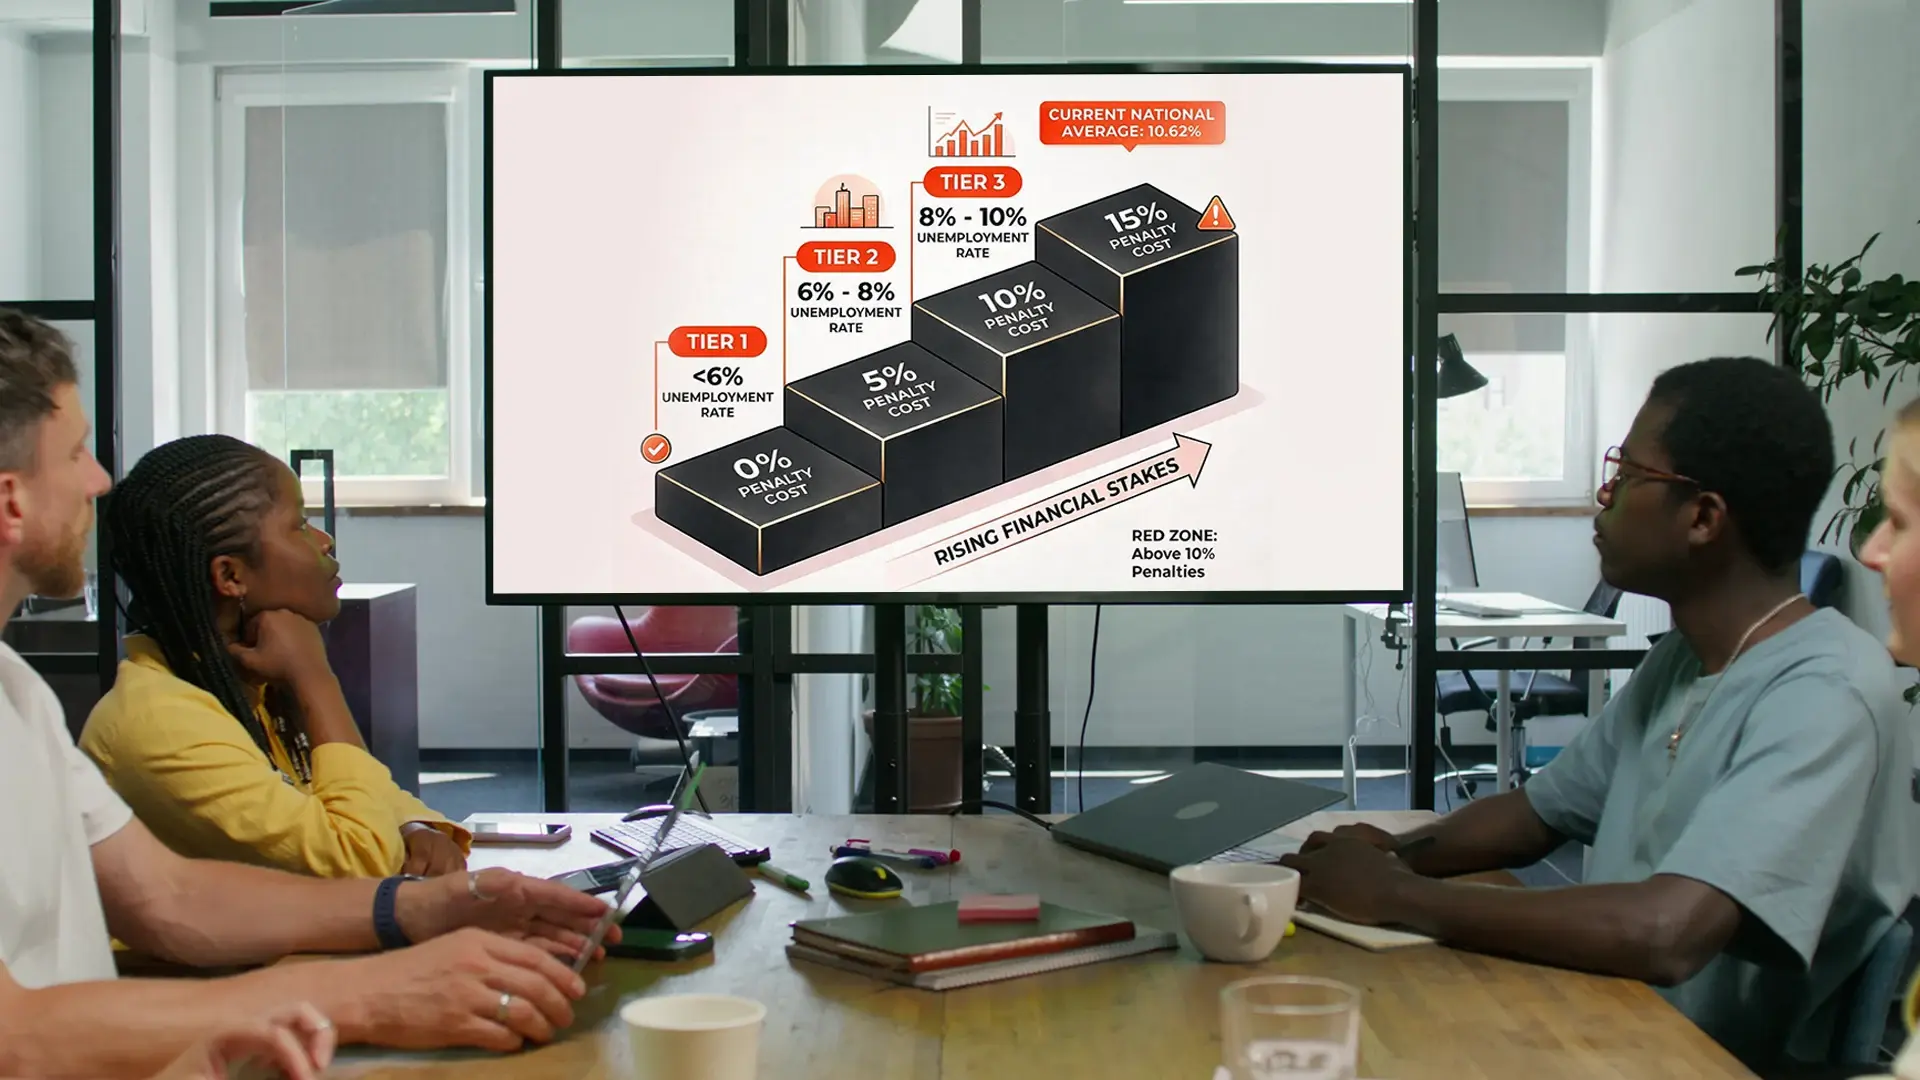
For as long as SNAP has existed, the federal government has paid the full cost of benefits while states paid to administer the program. Payment error rates mattered, but mostly as a compliance conversation between a state agency and its federal partner. The 2025 budget reconciliation law ends that arrangement. Beginning in fiscal year 2028, a state's SNAP payment error rate determines whether the state itself pays a share of benefit costs, and the threshold that matters is 6 percent.
This is the single largest change in SNAP's financing structure in the program's history, and it converts a quality metric into a budget line. Understanding exactly how the SNAP payment error rate penalty works, which year's performance counts, and where your state stands today is now a fiscal planning requirement, not a program-office detail. It is also the reason the verification problems described in our guide to social services eligibility verification have acquired a deadline.
What the Law Actually Says
The provisions live in Sections 10105 and 10106 of the enrolled bill, Public Law 119-21. The benefit cost-share works on four tiers, applied to each state's payment error rate:
| Payment error rate |
State share of benefit costs |
| Below 6 percent |
0 percent |
| 6 percent to below 8 percent |
5 percent |
| 8 percent to below 10 percent |
10 percent |
| 10 percent or above |
15 percent |
The schedule begins in fiscal year 2028. For that first year, the law lets each state elect whether its fiscal year 2025 or fiscal year 2026 error rate is used. From fiscal year 2029 onward, the rate from three fiscal years prior applies, which means the error rate a state posts in any given year becomes its cost-share basis three years later.
There is a delayed start for the states furthest from compliance. If a state's fiscal year 2025 error rate multiplied by 1.5 reaches 20 percent, which works out to an error rate of roughly 13.34 percent or higher, implementation is pushed to fiscal year 2029, with a parallel test on fiscal year 2026 rates that can push it to fiscal year 2030. The extra time is real, but it is time to fix the problem, not exemption from it.
Section 10106 adds a second fiscal blow that has received less attention. The federal share of SNAP administrative costs, which had been 50 percent, drops to 25 percent beginning in fiscal year 2027. States will absorb a larger share of the cost of running the program at the same moment error performance starts driving benefit cost exposure.
Where States Stand Against the Line
The most recent official measurements make the stakes concrete. The fiscal year 2025 error rates, released in June 2026, put the national combined payment error rate at 10.62 percent, composed of a 9.28 percent overpayment rate and a 1.33 percent underpayment rate. State performance ranged from 2.47 percent in South Dakota to 23.15 percent in Alaska.
Read those numbers against the tier table. A national rate above 10 percent means the average state, if it froze its performance today, would sit in the top tier when its number comes due. Only a minority of states currently perform below 6 percent. And because the fiscal year 2028 cost share is calculated from fiscal year 2025 or 2026 performance, with later years keyed to a three-year lookback, the window for improving the rate that will actually be billed is already open. Error reduction achieved in the current fiscal year is what shows up in the cost-share calculation three years from now.
The scale of the dollars involved follows from the size of the program. SNAP issued $95.8 billion in benefits in fiscal year 2025 to an average of 42.4 million monthly participants. A state carrying even a mid-single-digit share of its benefit issuance would be looking at an annual general-fund obligation in the tens of millions of dollars for a mid-size caseload, and considerably more for large states. Precise exposure depends on each state's issuance and where its rate lands, and budget offices are already running those projections.
Where Error Rates Actually Come From
A state cannot manage its way under the line without knowing what the error rate is made of, and here the federal quality control data is unambiguous. In the most recent QC annual report, income accounts for 55.5 percent of all payment errors. Deductions, many of which also depend on documents, add 16.6 percent. Household composition and other non-financial elements contribute far less.
Equally important is who makes the errors. Agencies cause 57 percent of them, clients 42 percent. For underpayments, agency-caused errors reach 82 percent. Deliberate fraud is a real but separate and much smaller phenomenon, with trafficking estimated at 1.6 percent of benefits. The error rate that will drive state cost sharing is, in the main, a measurement of how accurately income information moves from documents and databases into benefit calculations.
That specificity is good news, because it means the target is narrow. The income figures that generate most errors pass through one workflow: a caseworker reading pay stubs and employer records, keying figures into the eligibility system, and reconciling them against wage matches by hand, across systems that do not check each other. That workflow, and its costs in staff time and burnout, is examined closely in The Caseworker Bottleneck.
The Corrective Action Playbook, and Where It Plateaus
States above the national average already operate under a liability framework. Under existing quality control rules, USDA determines financial responsibility for states whose error rates exceed the national rate, with half of any liability typically invested in corrective action and half held at risk. The standard corrective action toolkit is familiar: targeted training, second-party review of error-prone case types, sampling and feedback loops, policy simplification where the state has options.
These measures work, and states have driven real improvements with them. They also share a ceiling. Training and second review add human checking on top of human checking, which raises cost per case and depends on staffing that many states cannot maintain. In recent surveys, most states reported frontline eligibility vacancies, and the federal government's own improper-payment analysis names turnover and training gaps among the persistent barriers. A corrective strategy built entirely on more careful humans competes for the same scarce humans.
The structural complement is to take the most error-prone step and change its nature. Document intelligence software reads income documents directly, extracts the figures with confidence scoring, and reconciles them automatically against wage matches and case records, flagging discrepancies before determination rather than after payment. Applied at intake and recertification, this attacks the 55.5 percent of errors that are income-born at their source, under human review, without waiting on an eligibility platform replacement. Platforms in this category, including VIDIZMO's AI Intelligence Hub, run as a layer over existing systems inside the state's own security boundary, a point that matters for the tax and Social Security data involved. How such a layer coexists with entrenched eligibility platforms is the subject of Why Eligibility Systems Don't Talk to Each Other.
Notably, technology investment of this kind aligns with how the federal government expects states to spend liability dollars: on addressing root causes. A state facing an at-risk liability and a future cost share has two reasons to fund the same fix.
The Budget Conversation This Now Requires
The 6 percent line moves SNAP accuracy out of the program office and into the budget office. A few planning realities follow.
The relevant year is now. With fiscal year 2028 billed on fiscal year 2025 or 2026 performance and later years on a three-year lookback, the error rate being generated by today's determinations is the one that will appear in a future appropriation. Improvement started two years before the bill arrives shows up exactly on time. Improvement started the year the bill arrives is two years late.
The administrative match cut compounds the timing. From fiscal year 2027, states pay 75 percent of administrative costs instead of 50 percent. Strategies that reduce errors by adding administrative labor become more expensive precisely when the incentive to reduce errors peaks. Approaches that reduce both errors and per-case labor are the only ones that improve both sides of the new ledger.
Federal funding for the fix itself remains available. Eligibility system improvements continue to draw enhanced federal match through the Advance Planning Document process, making the state share of a verification modernization a fraction of its sticker price. The mechanics, and how to write an APD that funds error-reduction technology, are covered in Is It APD-Fundable?.
A Planning Sequence for the Next Twelve Months
States approaching this systematically are working through a recognizable sequence, and none of it waits for federal implementation guidance to finish.
Start with the decomposition, not the headline rate. Pull your state's rows from the QC annual report and establish what your errors are made of: the income share, the deduction share, the agency-caused share, and the case types where they cluster. Two states with identical headline rates can need different fixes.
Model the election. For fiscal year 2028, the law allows a choice between the fiscal year 2025 and 2026 error rate. If your 2025 number is high and current-year operations are improving, the 2026 rate may be the better basis, which raises the value of every improvement landed before that measurement closes. Run the tier arithmetic against your actual issuance so the budget office sees exposure in dollars, not percentages.
Aim the operational work at the income pathway. Since income drives a majority of errors nationally, the highest-yield interventions sit at intake and recertification, where income documents get read and reconciled. That is where document extraction and automated cross-checking against wage data belong, and where their effect shows up in the sampled cases QC reviews.
Sequence the funding in parallel, not afterward. An Advance Planning Document takes time to prepare and approve, and spending before approval forfeits the enhanced match. A state that wants verification technology influencing its fiscal year 2026 error rate needs the APD moving now, alongside any corrective action investments already obligated under existing liability settlements, which are required to target root causes anyway.
Finally, put the three-year lookback on the budget calendar permanently. From fiscal year 2029 onward, each year's cost share is set by performance three years earlier, which means error-rate management becomes a standing fiscal function, not a one-time compliance push.
The Bottom Line
The 6 percent line turns a two-decade-old operational weakness into a recurring budget exposure with a statutory formula and a start date. The error rate that will be billed is being generated in eligibility offices right now, by a verification workflow whose failure modes are documented in the government's own data: income figures, moved by hand, across systems that do not check each other. States that treat fiscal year 2028 as the deadline will be late. States that treat the current recertification cycle as the deadline have a realistic path under the line. The full picture of that path starts with the guide to social services eligibility verification.